- 类型
- 对比表 2 列 · 深色 · AI
- 布局
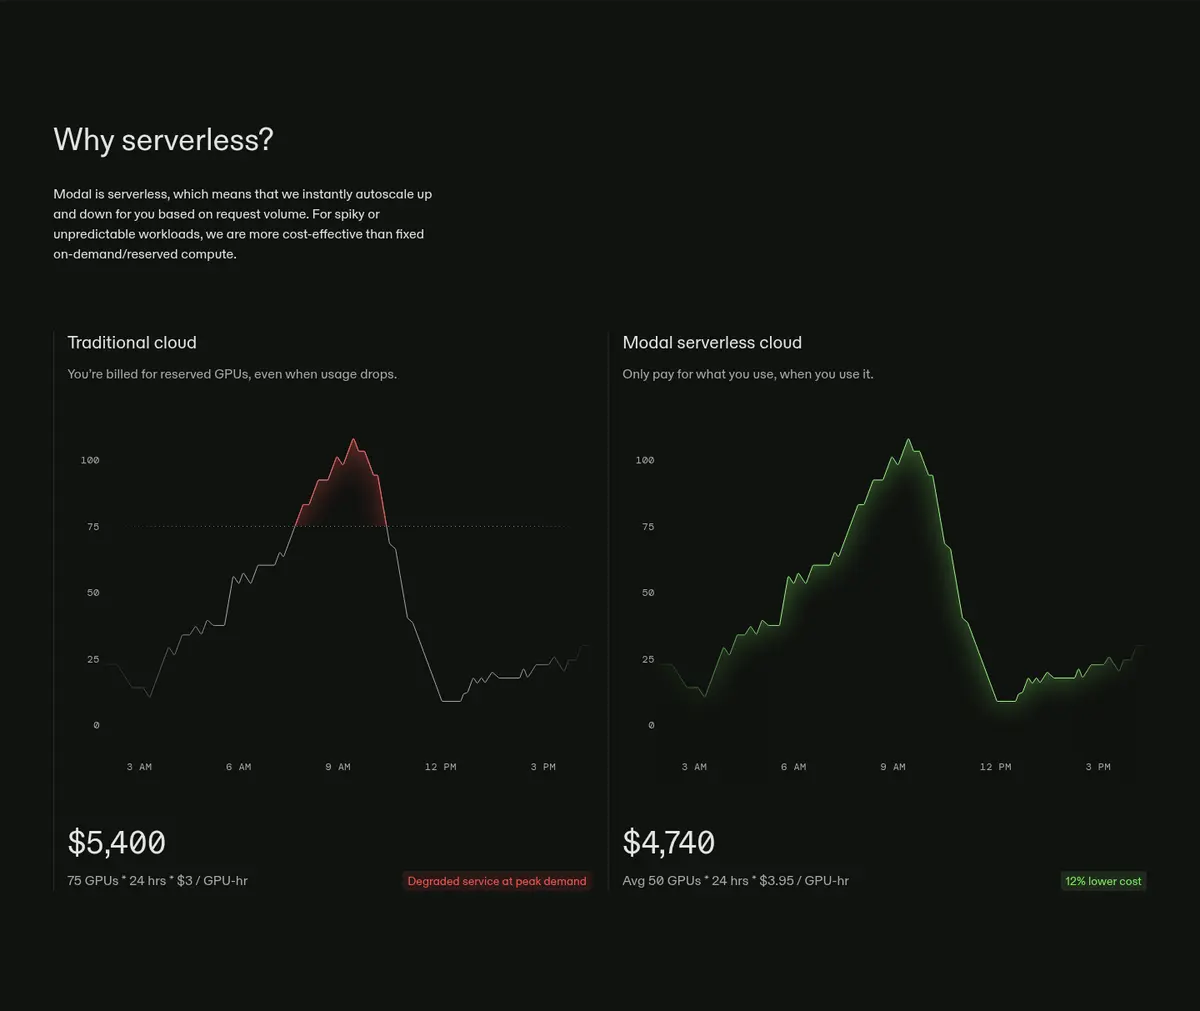
- A short explanatory introduction precedes two side-by-side panels, each pairing a usage graph with a cost summary.
- UX 模式
- Explains autoscaling for variable workloadsContrasts reserved-capacity cloud billing with usage-based bVisualizes cost against changing request volumeHighlights the estimated savings
- UI 模式
- Traditional-cloud and Modal comparison panelsPaired time-series area chartsCost totals beneath each chartRed and green labels for overpayment and savings
- 说明
- Shows how serverless autoscaling responds to fluctuating demand by comparing a traditional reserved-capacity cloud bill with Modal’s usage-based cost for the same workload. Charts and totals make the claimed savings tangible.
- 页面上的标题
- Why serverless? / Traditional cloud / Modal serverless cloud